Wednesday, January 2, 2008

Chromosomes in eukaryotes

Eukaryotes (cells with nuclei such as plants, yeast, and animals) possess multiple large linear chromosomes contained in the cell's nucleus. Each chromosome has one centromere, with one or two arms projecting from the centromere, although under most circumstances these arms are not visible as such. In addition most eukaryotes have a small circular mitochondrial genome, and some eukaryotes may have additional small circular or linear cytoplasmic chromosomes.

In the nuclear chromosomes of eukaryotes, the uncondensed DNA exists in a semi-ordered structure, where it is wrapped around histones (structural proteins), forming a composite material called chromatin.

Chromatin

Fig. 2: The major structures in DNA compaction; DNA, the nucleosome, the 10nm "beads-on-a-string" fibre, the 30nm fibre and the metaphase chromosome.

Chromatin is the complex of DNA and protein found in the eukaryotic nucleus which packages chromosomes. The structure of chromatin varies significantly between different stages of the cell cycle, according to the requirements of the DNA.

Interphase chromatin

During interphase (the period of the cell cycle where the cell is not dividing) two types of chromatin can be distinguished:

  • Euchromatin, which consists of DNA that is active, e.g., expressed as protein.
  • Heterochromatin, which consists of mostly inactive DNA. It seems to serve structural purposes during the chromosomal stages. Heterochromatin can be further distinguished into two types:
    • Constitutive heterochromatin, which is never expressed. It is located around the centromere and usually contains repetitive sequences.
    • Facultative heterochromatin, which is sometimes expressed.

Individual chromosomes cannot be distinguished at this stage - they appear in the nucleus as a homogeneous tangled mix of DNA and protein.

Metaphase chromatin and division

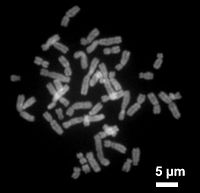
Human chromosomes during metaphase.

In the early stages of mitosis or meiosis (cell division), the chromatin strands become more and more condensed. They cease to function as accessible genetic material (transcription stops) and become a compact transportable form. This compact form makes the individual chromosomes visible, and they form the classic four arm structure, a pair of sister chromatids attached to each other at the centromere. The shorter arms are called p arms (from the French petit, small) and the longer arms are called q arms (q follows p in the Latin alphabet). This is the only natural context in which individual chromosomes are visible with an optical microscope.

During divisions long microtubules attach to the centromere and the two opposite ends of the cell. The microtubules then pull the chromatids apart, so that each daughter cell inherits one set of chromatids. Once the cells have divided, the chromatids are uncoiled and can function again as chromatin. In spite of their appearance, chromosomes are structurally highly condensed which enables these giant DNA structures to be contained within a cell nucleus (Fig. 2).

The self assembled microtubules form the spindle, which attaches to chromosomes at specialized structures called kinetochores, one of which is present on each sister chromatid. A special DNA base sequence in the region of the kinetochores provides, along with special proteins, longer-lasting attachment in this region.


http://en.wikipedia.org/wiki/Chromosome

Chromosome

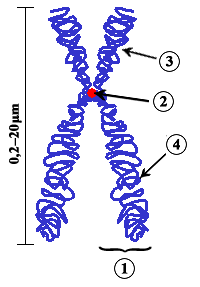
A scheme of a condensed (metaphase) chromosome. (1) Chromatid - one of the two identical parts of the chromosome after S phase. (2) Centromere - the point where the two chromatids touch, and where the microtubules attach. (3) Short arm. (4) Long arm.

Chromosomes are organized structures of DNA and proteins that are found in cells. Chromosomes contain a single continuous piece of DNA, which contains many genes, regulatory elements and other nucleotide sequences. Chromosomes also contain DNA-bound proteins, which serve to package the DNA and control its functions. The word chromosome comes from the Greek χρῶμα (chroma, color) and σῶμα (soma, body) due to their property of being stained very strongly by some dyes.

Chromosomes vary extensively between different organisms. The DNA molecule may be circular or linear, and can contain anything from tens of kilobase pairs to hundreds of megabase pairs. Typically eukaryotic cells (cells with nuclei) have large linear chromosomes and prokaryotic cells (cells without nuclei) smaller circular chromosomes, although there are many exceptions to this rule. Furthermore, cells may contain more than one type of chromosome; for example mitochondria in most eukaryotes and chloroplasts in plants have their own small chromosomes.

In eukaryotes, nuclear chromosomes are packaged by proteins into a condensed structure called chromatin. This allows the massively-long DNA molecules to fit into the cell nucleus. The structure of chromatin varies through the cell cycle, and is responsible for the organisation of chromosomes into the classic four-arm structure during mitosis and meiosis.

"Chromosome" is a rather loosely defined term. In prokaryotes, a small circular DNA molecule may be called either a plasmid or a small chromosome. These small circular genomes are also found in mitochondria, and chloroplasts, reflecting their bacterial origins. The simplest chromosomes are found in viruses: these DNA or RNA molecules are short linear or circular chromosomes that often lack any structural proteins.

History

Chromosomes were first observed in plant cells by a Swiss botanist named Karl Wilhelm von Nägeli in 1842, and independently in Ascaris worms by Belgian scientist Edouard Van Beneden (1846-1910). The use of basophilic aniline dyes was a fundamentally new technique for effectively staining the chromatin material in the nucleus. Their behavior in animal (salamander) cells was later described in detail by German cytologist and professor of anatomy Walther Flemming, the discoverer of mitosis, in 1882. The name was invented later by another German anatomist, Heinrich von Waldeyer in 1888.


http://en.wikipedia.org/wiki/Chromosome

Genetic linkage - Linkage map

Linkage map

A linkage map is a chromosome map of a species or experimental population that shows the position of its known genes and/or markers relative to each other in terms of recombination frequency, rather than as specific physical distance along each chromosome.

A genetic map is a map based on the frequencies of recombination between markers during crossover of homologous chromosomes. The greater the frequency of recombination (segregation) between two genetic markers, the farther apart they are assumed to be. Conversely, the higher the frequency of association between the markers, the smaller the physical distance between them. Historically, the markers originally used were detectable phenotypes (enzyme production, eye color) derived from coding DNA sequences; eventually, confirmed or assumed noncoding DNA sequences such as microsatellites or those generating restriction fragment length polymorphisms (RFLPs) have been used.

Genetic maps help researchers to locate other markers, such as other genes by testing for genetic linkage of the already known markers.

A genetic map is not a gene map.

LOD score method for estimating recombination frequency

The lod score (logarithm (base 10) of odds, also called logit by mathematicians) is a statistical test often used for linkage analysis in human populations, and also in animal and plant populations. The test was developed by Newton E. Morton. Computerized lod score analysis is a simple way to analyze complex family pedigrees in order to determine the linkage between mendelian traits (or between a trait and a marker, or two markers).

The method is described in greater detail by Strachan and Read [1]. Briefly, it works as follows:

  1. Establish a pedigree
  2. Make a number of estimates of recombination frequency
  3. Calculate a lod score for each estimate
  4. The estimate with the highest Lod score will be considered the best estimate

The Lod score is calculated as follows:

  \begin{align} LOD = Z & = \log{10} \frac{ \mbox{probability of birth sequence with a given linkage value} }{ \mbox{probability of birth sequence with no linkage} } \\  & = \log{10} \frac{(1-\theta)^{NR} \times \theta^R}{ 0.5^{(NR + R)} } \end{align}

NR denotes the number of non-recombinant offspring, and R denotes the number of recombinant offspring. The reason 0.5 is used in the denominator is that any alleles that are completely unlinked (e.g. alleles on separate chromosomes) have a 50% chance of recombination, due to independent assortment.

In practice, lod scores are looked up in a table which lists lod scores for various standard pedigrees and various values of recombination frequency.

By convention, a lod score greater than 3.0 is considered evidence for linkage. (A score of 3.0 means the likelihood of observing the given pedigree if the two loci are not linked is less than 1 in 1000). On the other hand, a lod score less than -2.0 is considered evidence to exclude linkage. Although it is very unlikely that a LOD score of 3 would be obtained from a single pedigree, the mathematical properties of the test allow data from a number of pedigrees to be combined by summing the LOD scores.

Recombination frequency

Recombination frequency (θ) is when crossing-over will take place between two loci (or genes) during meiosis. Recombination frequency is a measure of genetic linkage and is used in the creation of a genetic linkage map. A centimorgan (cM) is a unit that describes a recombination frequency of 1%.

During meiosis, chromosomes assort randomly into gametes, such that the segregation of alleles of one gene is independent of alleles of another gene. This is stated in Mendel's Second Law and is known as the law of independent assortment. The law of independent assortment always holds true for genes that are located on different chromosomes, but for genes that are on the same chromosome, it does not always hold true.

As an example of independent assortment, consider the crossing of the pure-bred homozygote parental strain with genotype AABB with a different pure-bred strain with genotype aabb. A and a and B and b represent the alleles of genes A and B. Crossing these homozygous parental strains will result in F1 generation offspring with genotype AaBb. The F1 offspring AaBb produces gametes that are AB, Ab, aB, and ab with equal frequencies (25%) due to the law of independent assortment. Note that 2 of the 4 gametes (50 %)—Ab and aB—were not present in the parental generation. These gametes represent recombinant gametes. Recombinant gametes are those gametes that differ from both of the haploid gametes that made up the diploid cell. In this example, the recombination frequency is 50% since 2 of the 4 gametes were recombinant gametes.

The recombination frequency will be 50% when two genes are located on different chromosomes or when they are widely separated on the same chromosome. This is a consequence of independent assortment.

When two genes are close together on the same chromosome, they do not assort independently and are said to be linked. Whereas genes located on different chromosomes assort independently and have a recombination frequency of 50%, linked genes have a recombination frequency that is less than 50%.

As an example of linkage, consider the classic experiment by William Bateson and Reginald Punnett. They were interested in trait inheritance in the sweet pea and were studying two genes—the gene for flower color (P, purple, and p, red) and the gene affecting the shape of pollen grains (L, long, and l, round). They crossed the pure lines PPLL and ppll and then self-crossed the resulting PpLl lines. According to Mendelian genetics, the expected phenotypes would occur in a 9:3:3:1 ratio of PL:Pl:pL:pl. To their surprise, they observed an increased frequency of PL and pl and a decreased frequency of Pl and pL (see chart below).

Bateson and Punnett experiment
Phenotype and genotype Observed Expected from 9:3:3:1 ratio
Purple, long (P_L_) 284 216
Purple, round (P_ll) 21 72
Red, long (ppL_) 21 72
Red, round (ppll) 55 24

Their experiment revealed linkage (or coupling) between the P and L alleles and the p and l alleles. The frequency of P occurring together with L and with p occurring together with l is greater than that of the recombinant Pl and pL. The recombinantion frequency cannot be computed directly from this experiment, but intuitively it is less than 50%.

The progeny in this case received two dominant alleles linked on one chromosome (referred to as coupling or cis arrangement). However, after crossover, some progeny could have received one parental chromosome with a dominant allele for one trait (eg Purple) linked to a recessive allele for a second trait (eg round) with the opposite being true for the other parental chromosome (eg red and Long). This is referred to as repulsion or a trans arrangement. The phenotype here would still be purple and long but a test cross of this individual with the recessive parent would produce progeny with much greater proportion of the two crossover phenotypes. While such a problem may not seem likely from this example, unfavorable repulsion linkages do appear when breeding for disease resistance in some crops.

When two genes are located on the same chromosome, the chance of a crossover producing recombination between the genes is directly related to the distance between the two genes. Thus, the use of recombinantion frequencies has been used to develop linkage maps or genetic maps.


http://en.wikipedia.org/wiki/Genetic_mapping

Fujitsu to cease Plasma production

The Japanese manufacturer Fujitsu has announced that it will stop producing Plasma screens after nearly fifteen years of commercial involvement with the technology.

In 1992 the Japanese electronics giant was the the first manufacturer to make a Plasma TV available to the general buying public. Surprisingly, their first screen was a 21in plasma monitor for PC's. The company scored another first in 1996 with the introduction of the first 42in widescreen plasma.

Fujitsu has cited the erosion of profit margins along with intense competition from LCD as the reasons why they are leaving the market. In fact, Fujitsu has long since stopped producing Plasma screens in large number, providing high end niche products for boutique electronic stores in the US and UK.

The plasma sector of the flat panel market seems to be having a tough time at the moment with Pioneer announcing recently that it had shelved plans to open a new production facility after falling demand for plasma screens. LCD certainly seems to be in the ascendancy with Sony announcing recently that it is pulling out of the rear projection market.

http://hdtvorg.co.uk/news/articles/2008010201.htm